Welcome to STA 221!
Jan 09, 2025
Check-in on Ed Discussion!
Click on the link or scan the QR code to answer the Ed Discussion poll
https://edstem.org/us/courses/70811/discussion/5950645

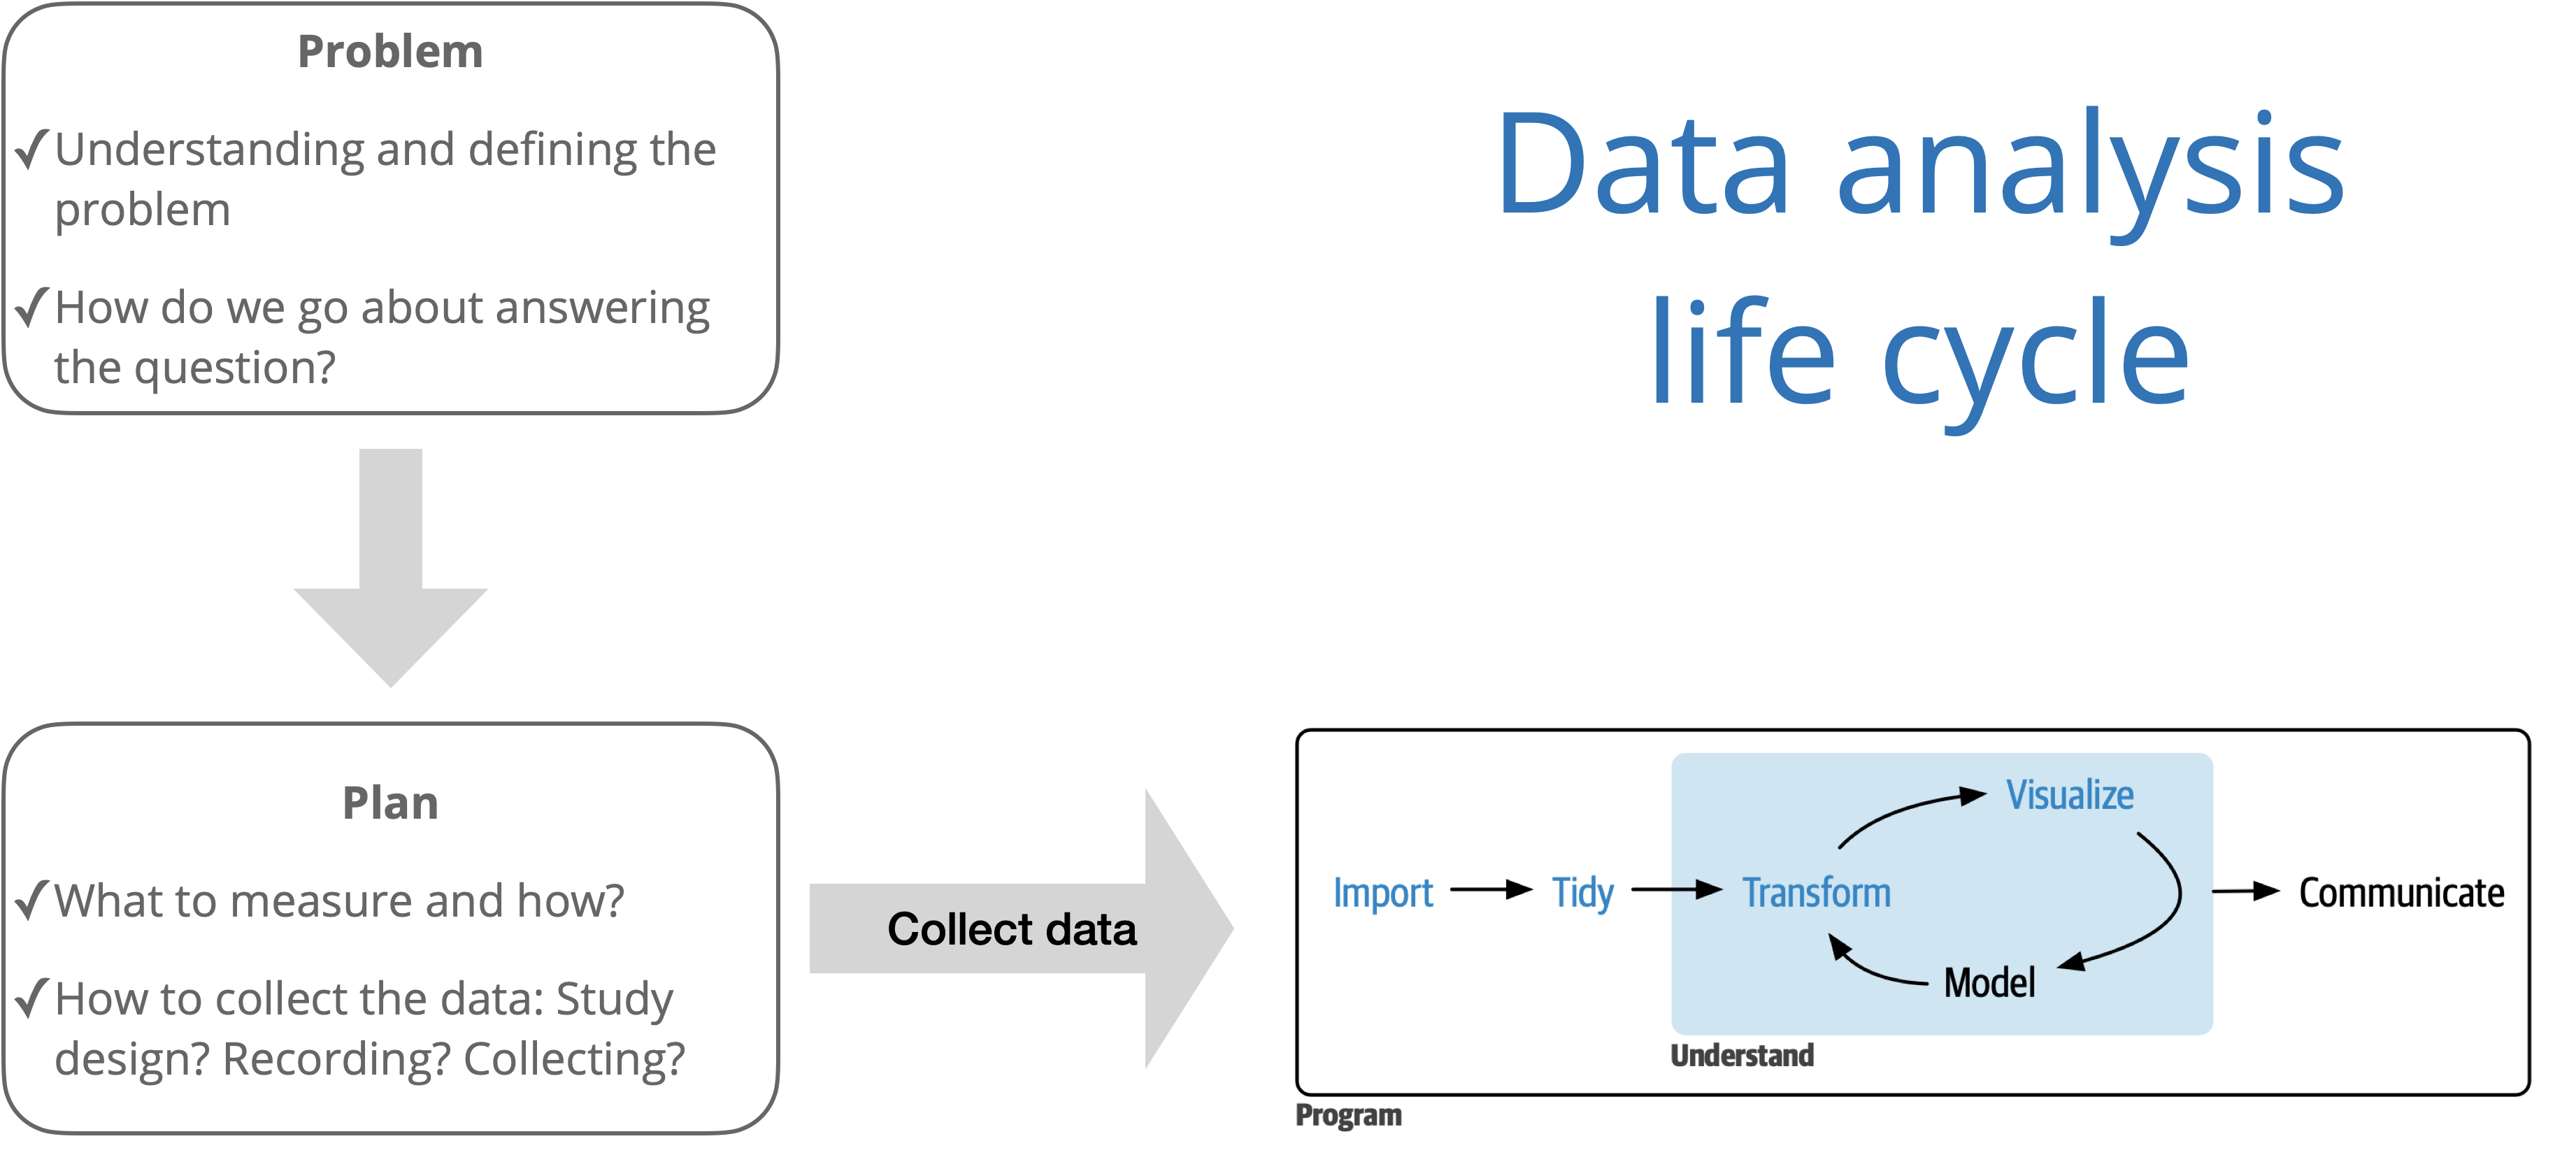
Source: R for Data Science with additions from The Art of Statistics: How to Learn from Data.
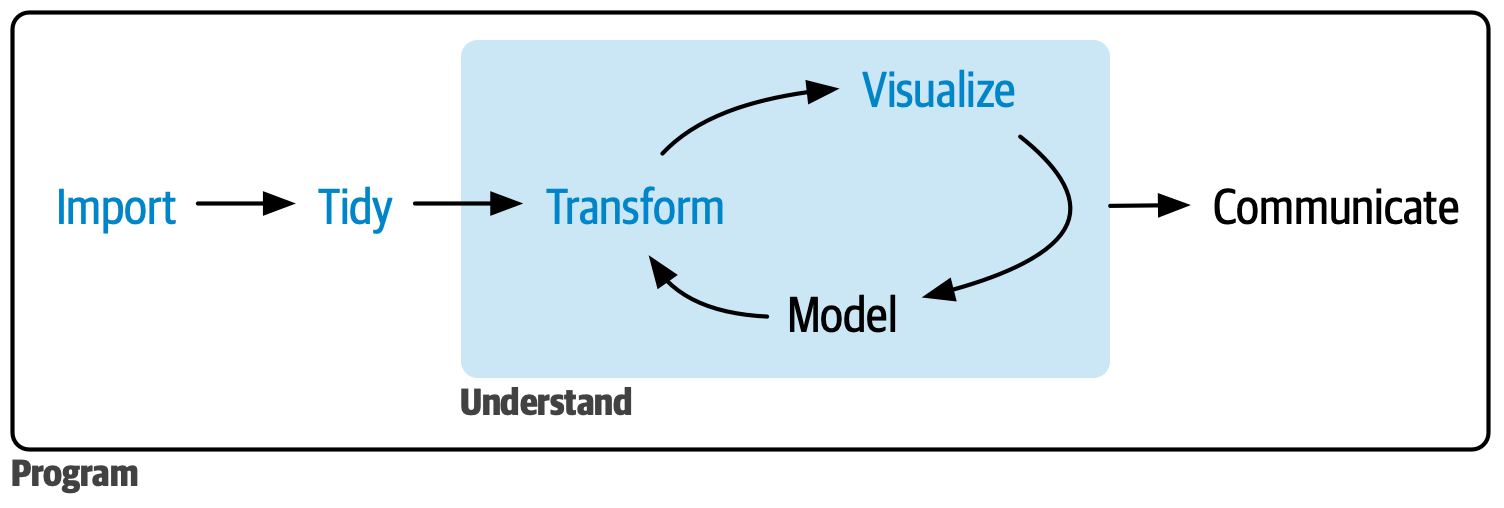
Source:R for Data Science
Regression in practice
Regression in practice
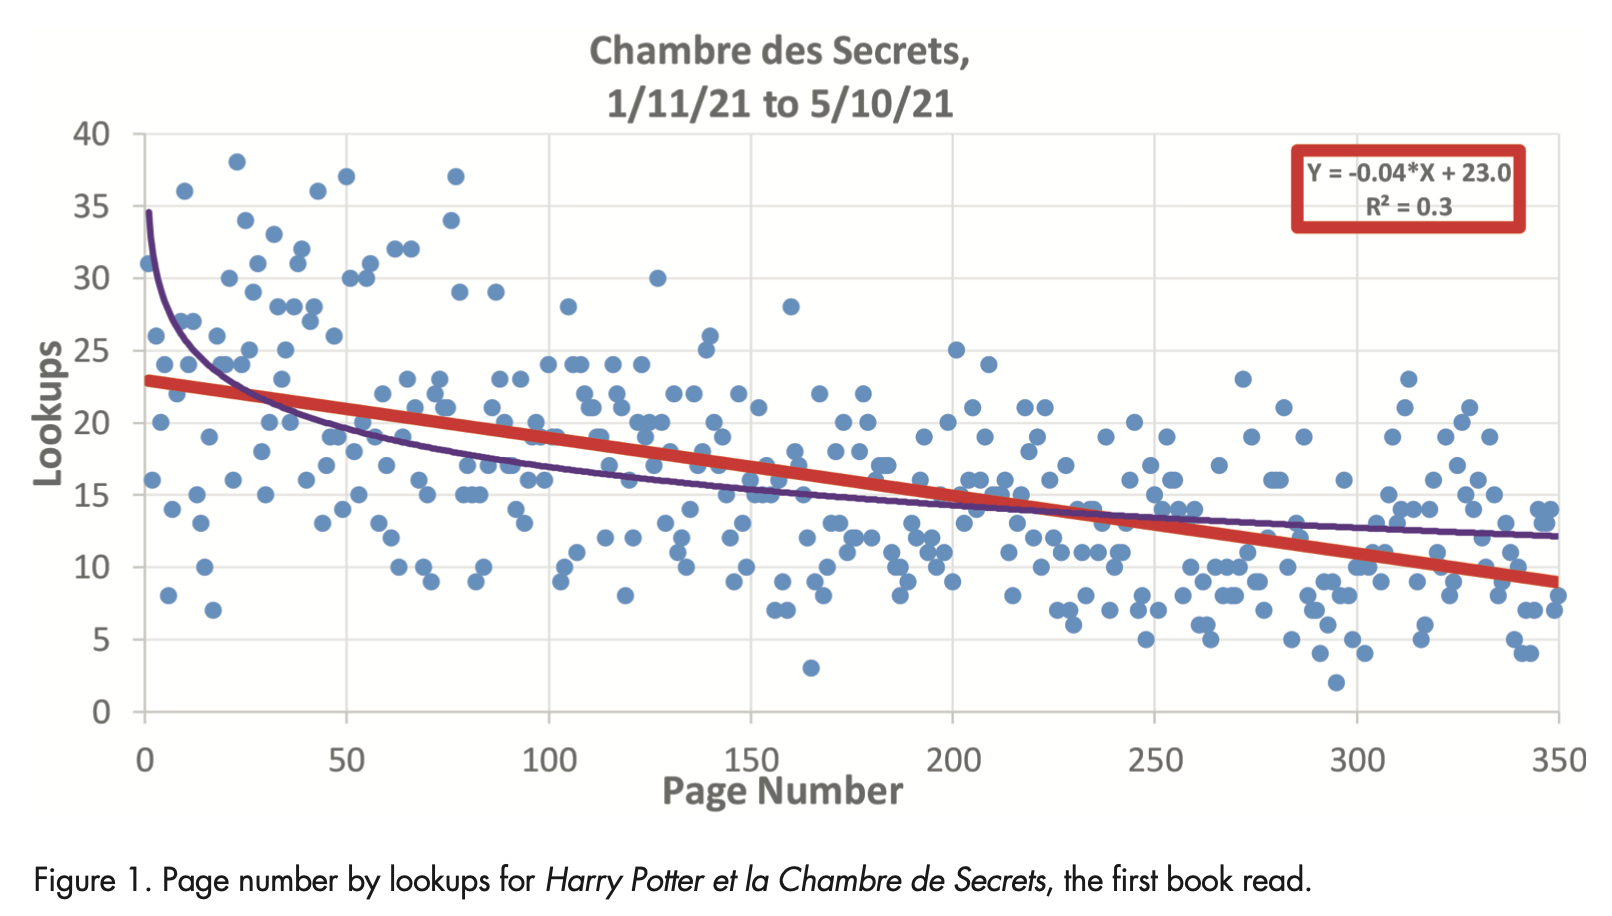
\[ \text{Lookups} = 23.0 - 0.04 \times \text{Page Number} \]
Computing toolkit
All analyses using R, a statistical programming language
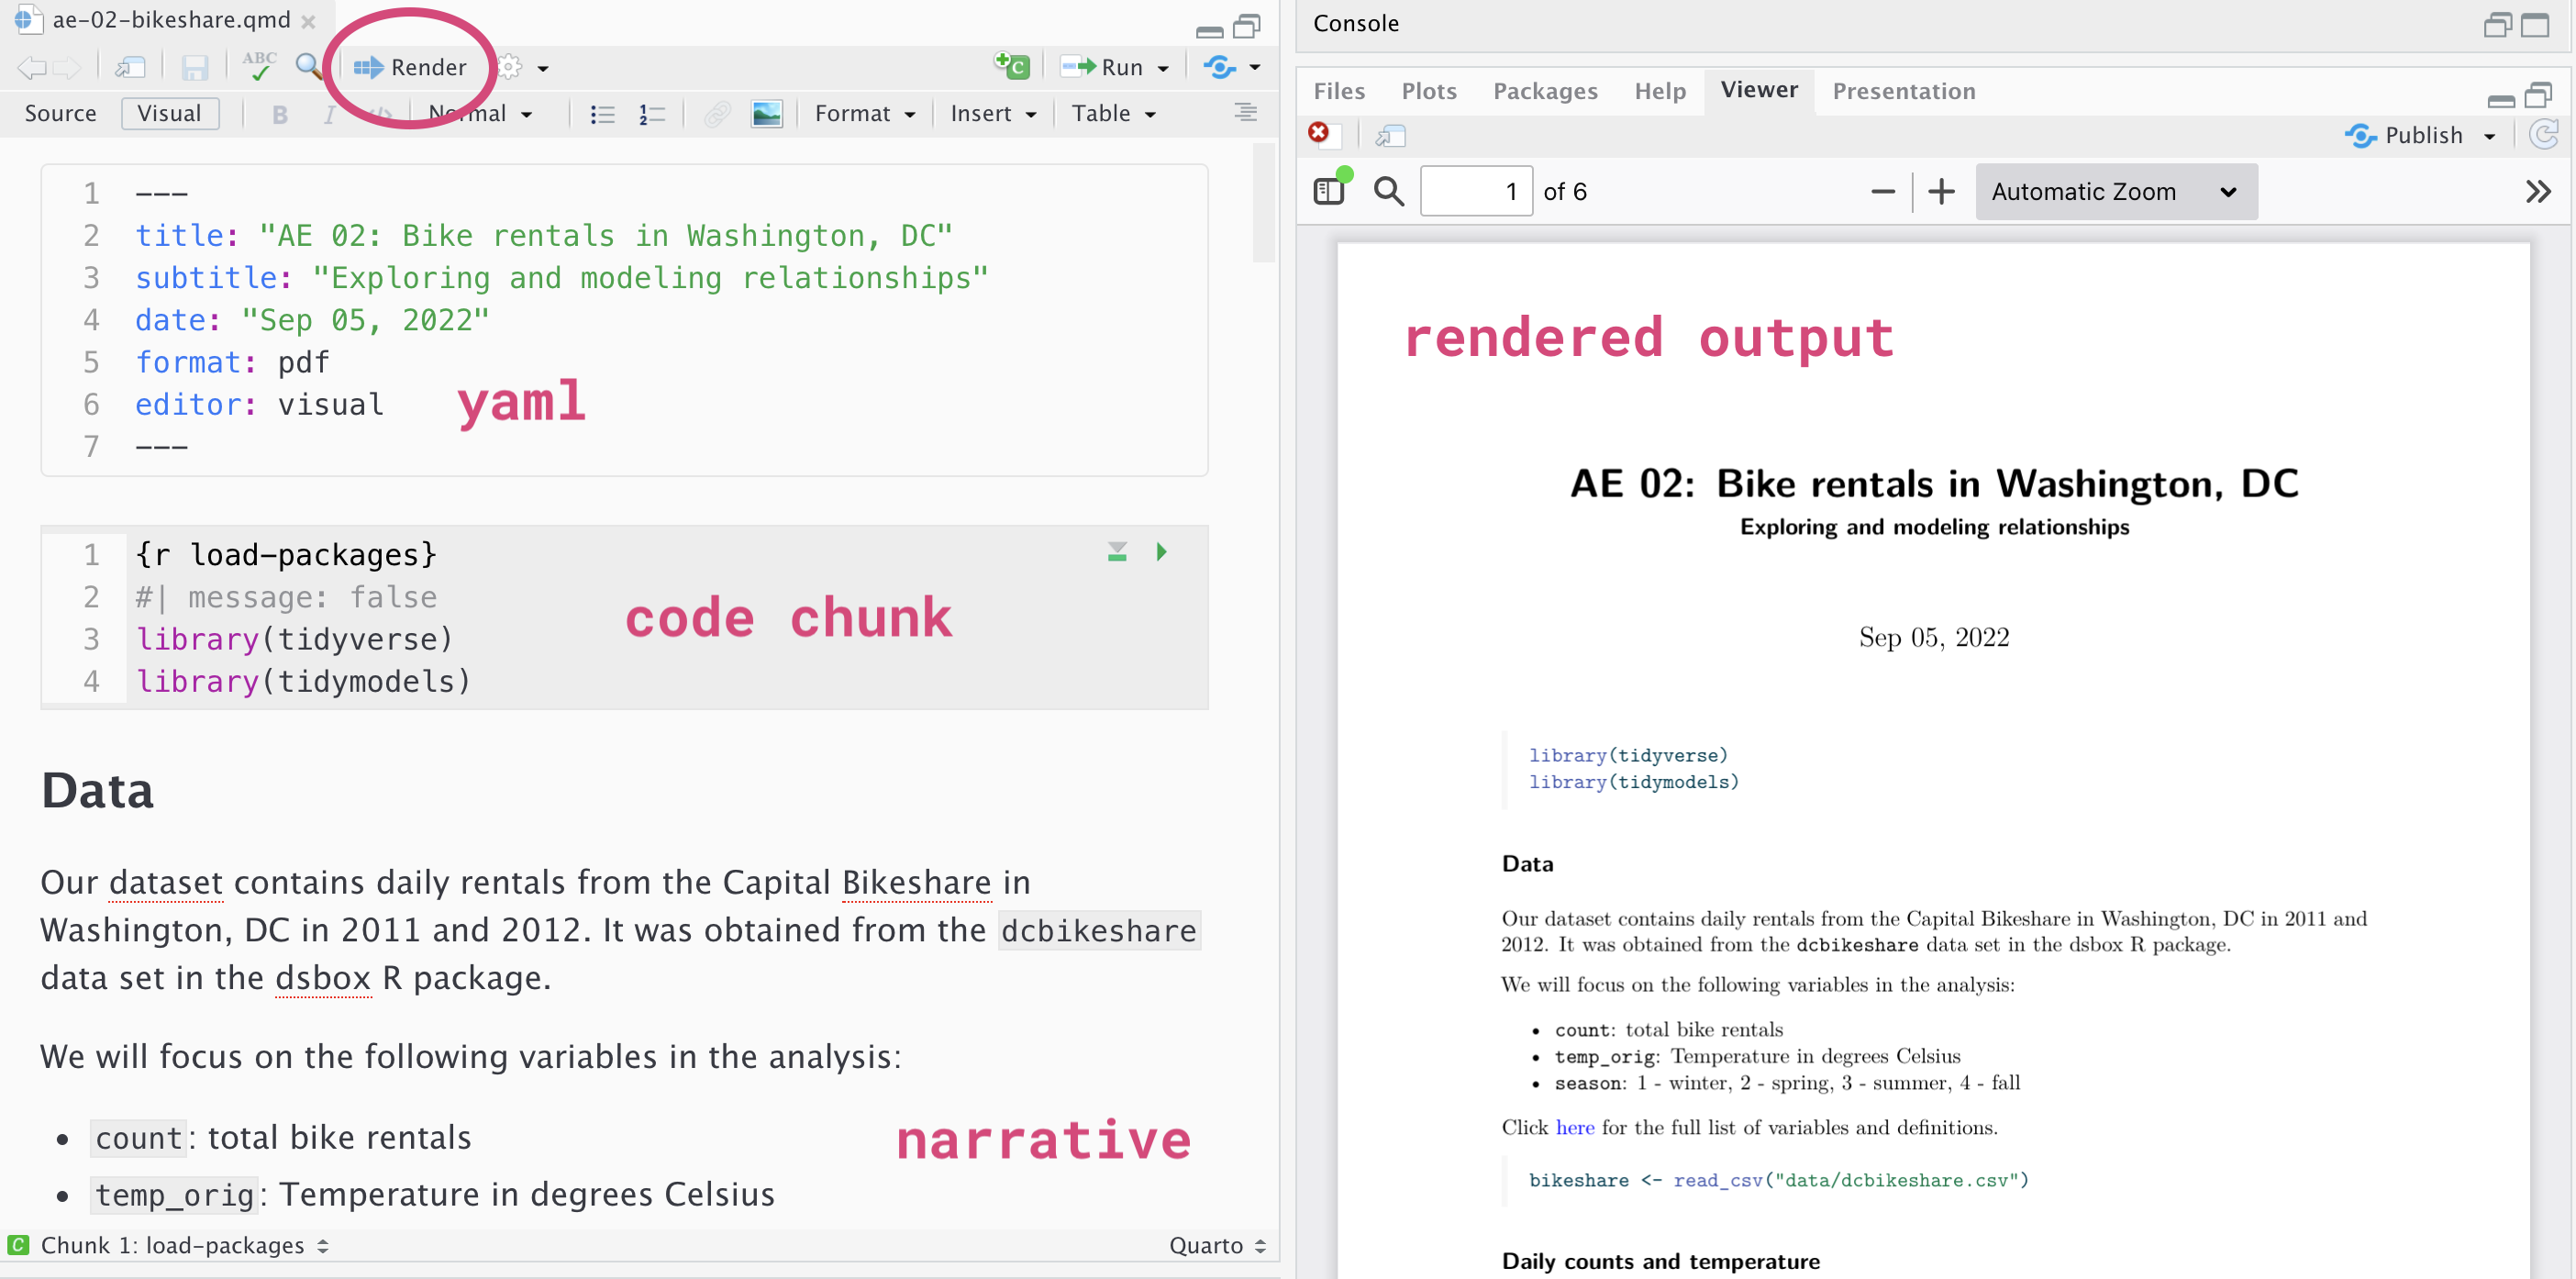
Write reproducible reports in Quarto
Access RStudio through STA 221 Docker Containers

Access assignments
Facilitates version control and collaboration
All work in STA 221 course organization
Why is reproducibility important?
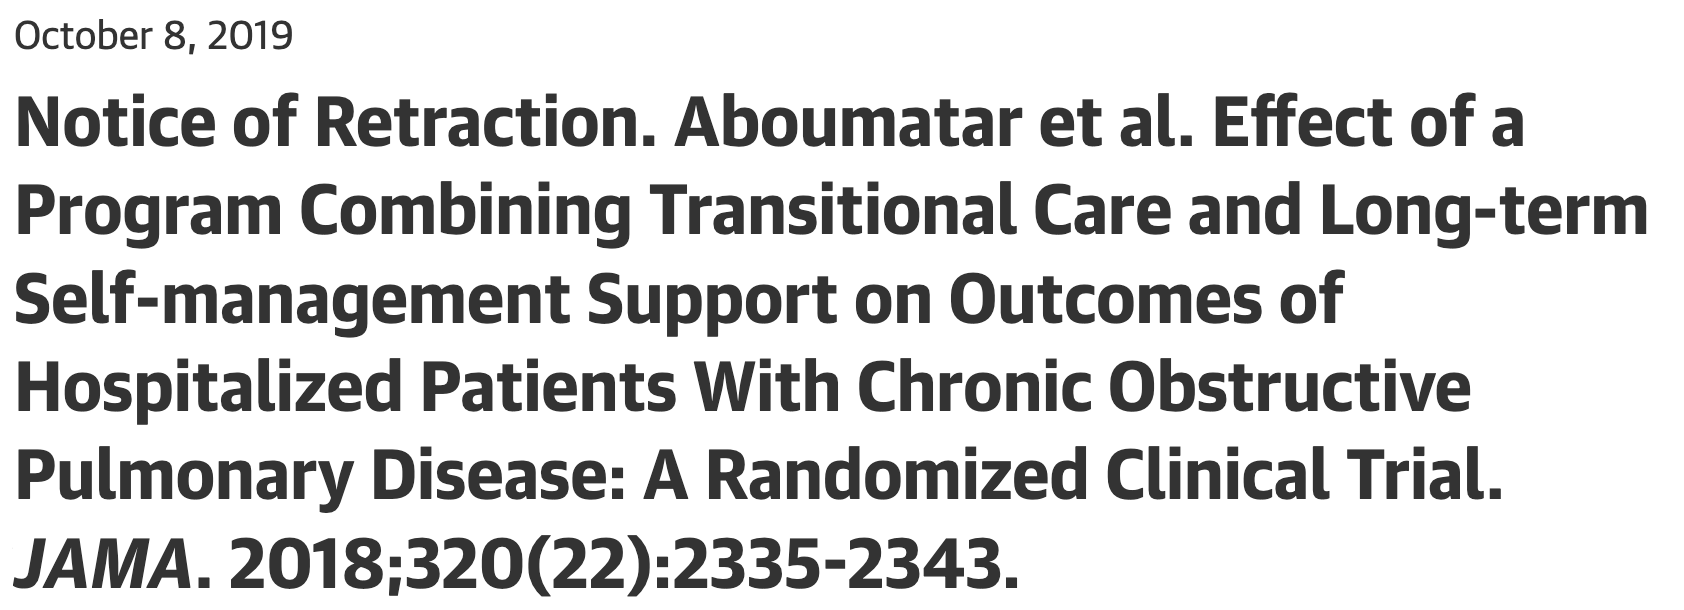
Originally reported “the intervention, compared with usual care, resulted in a fewer number of mean COPD-related hospitalizations and emergency department visits at 6 months per participant.”
There were actually more COPD-related hospitalizations and emergency department visits in the intervention group compared to the control group
Mixed up the intervention vs. control group using “0/1” coding
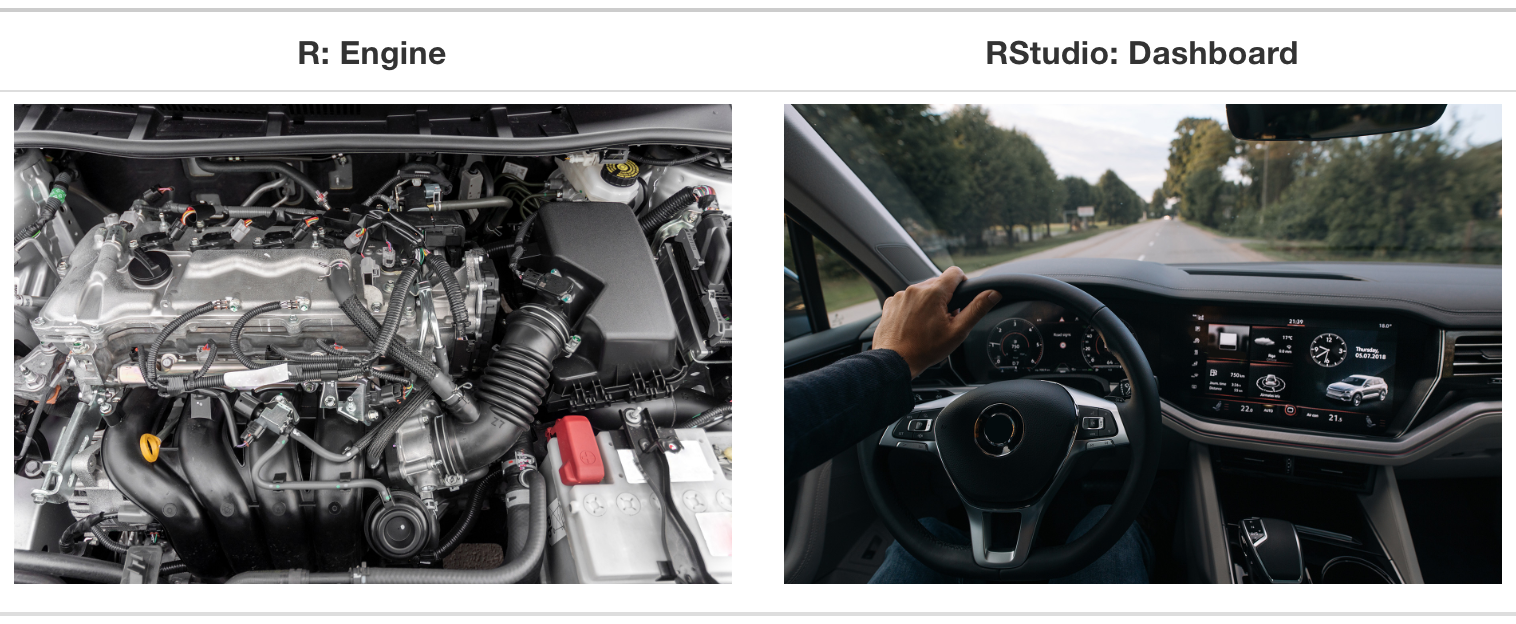
R and RStudio
R is a statistical programming language
RStudio is a convenient interface for R (an integrated development environment, IDE)
Source: Statistical Inference via Data Science
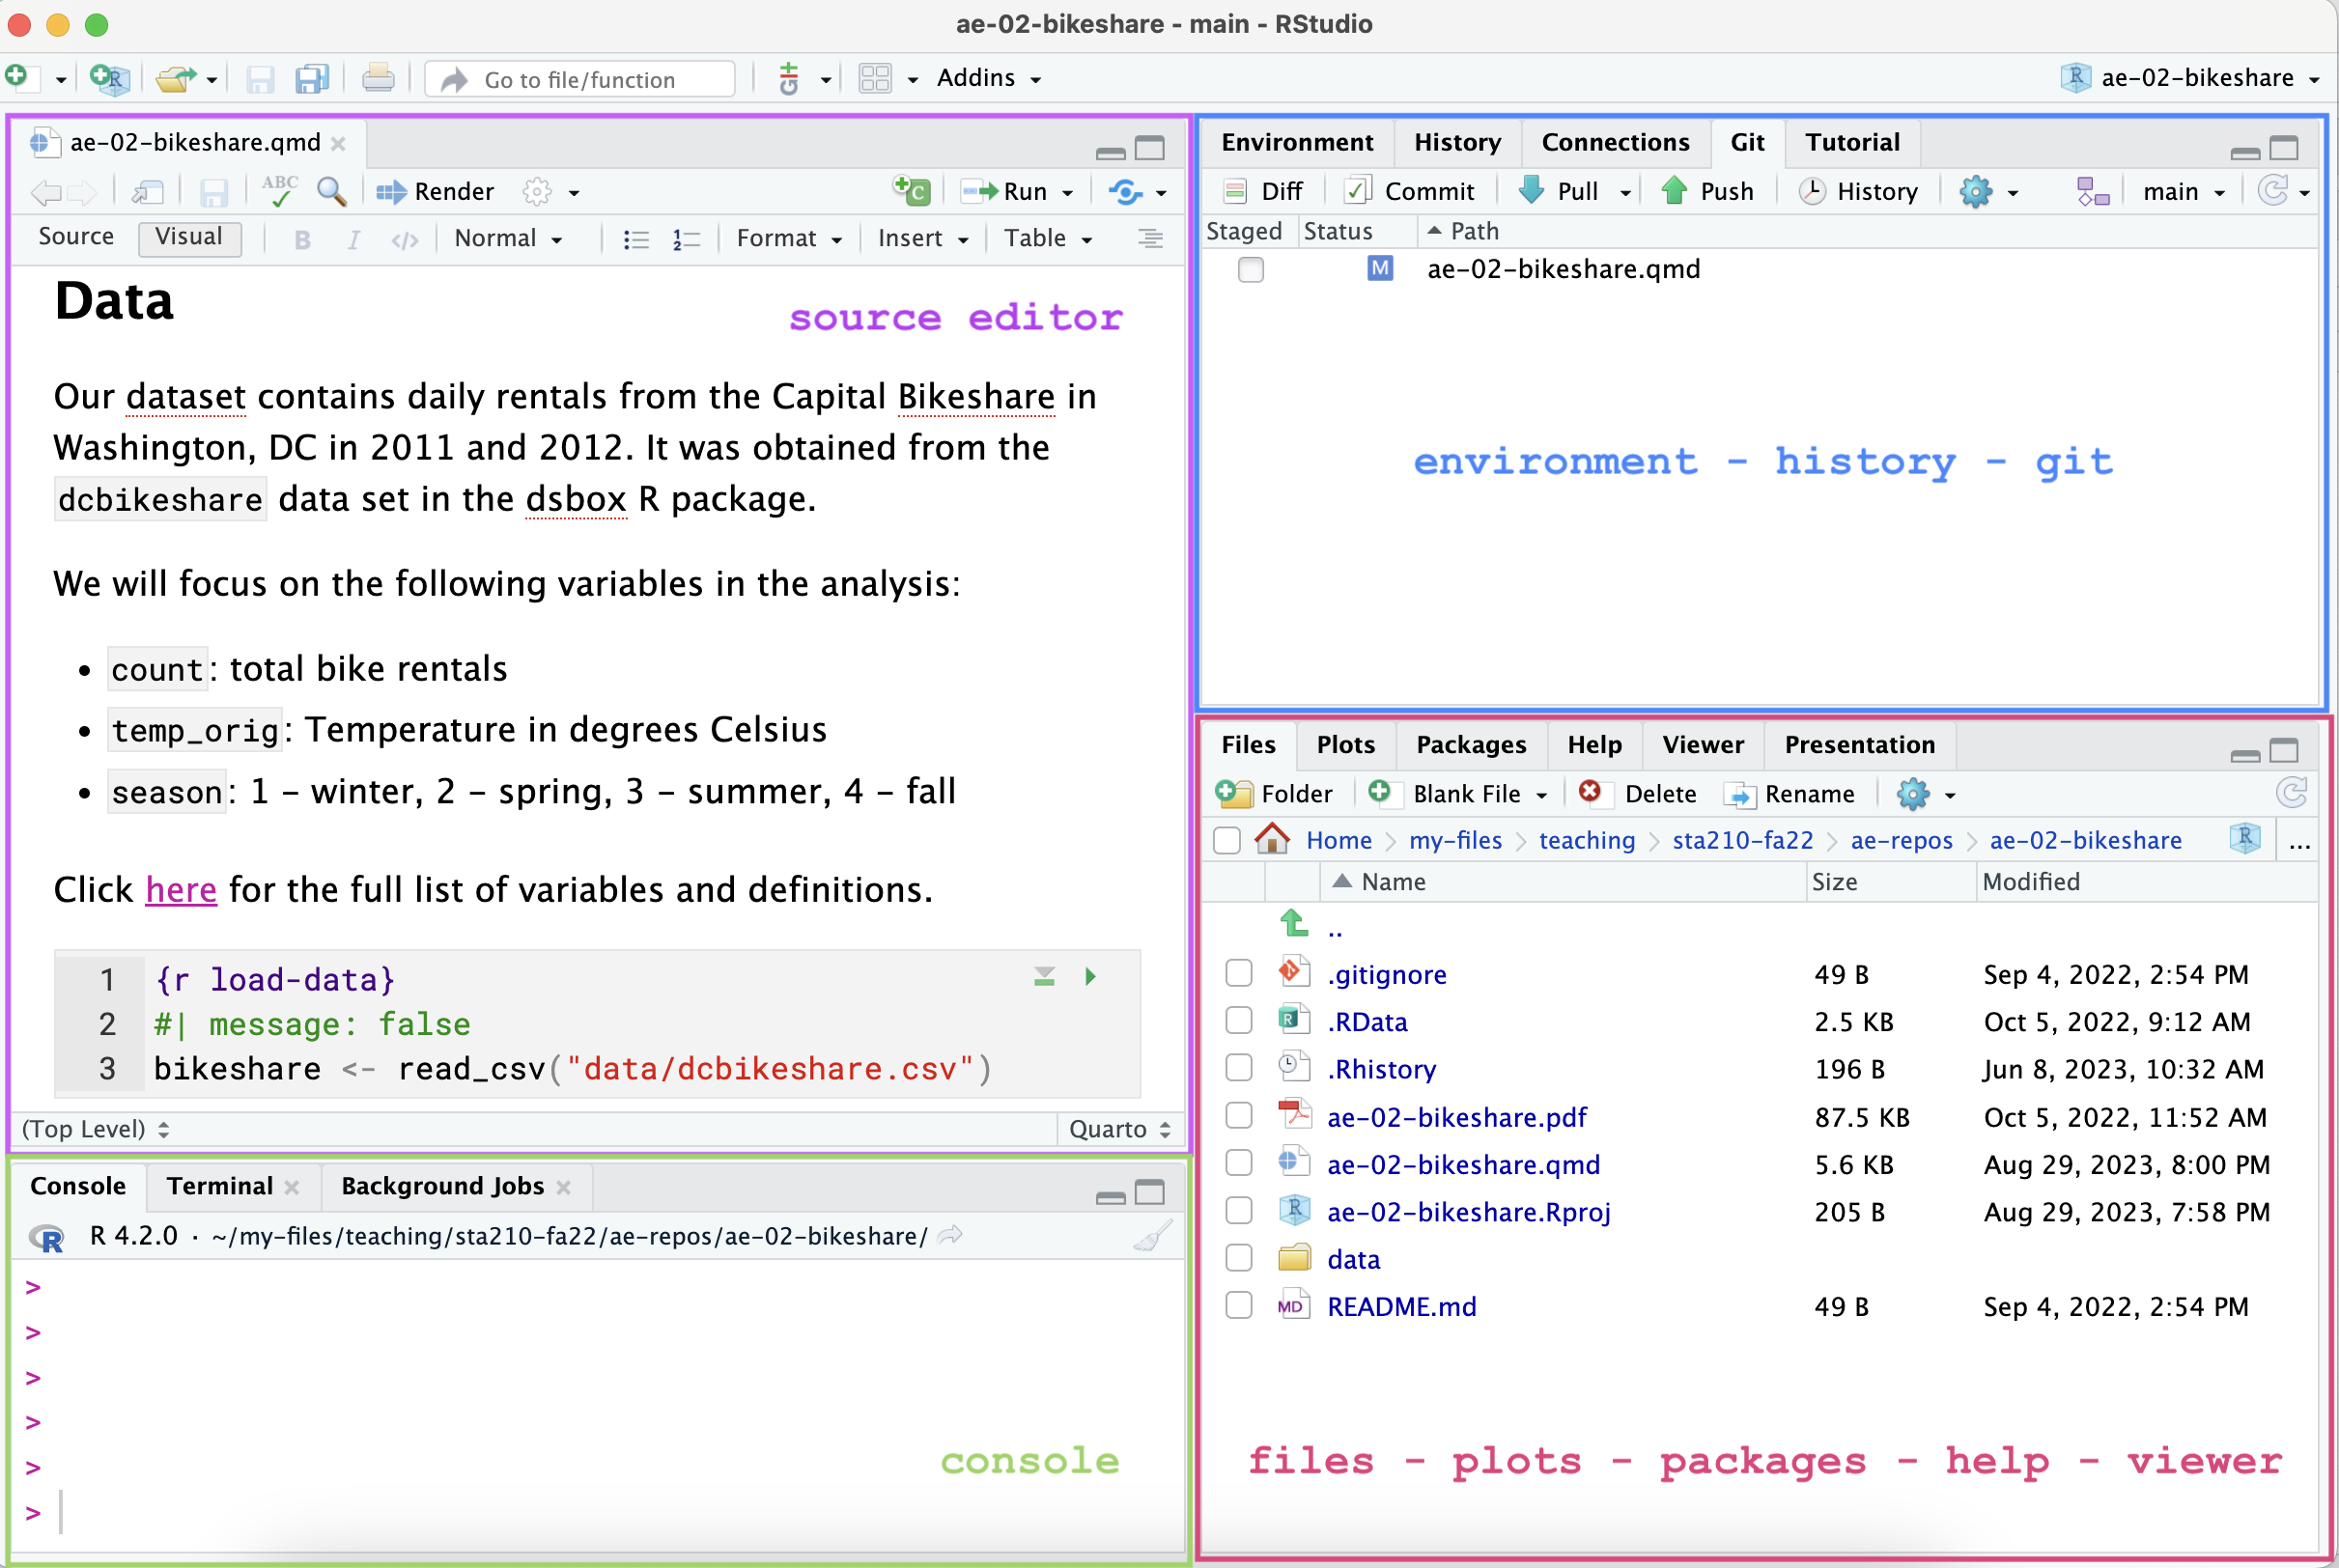
RStudio IDE
Quarto
What is versioning?
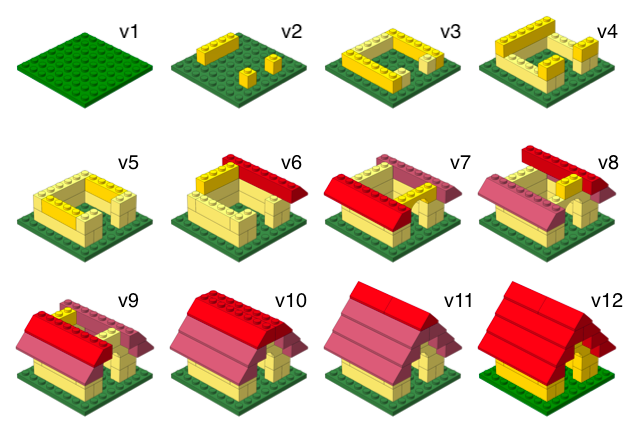
What is versioning?
with human readable messages

Why do we need version control?
Provides a clear record of how the analysis methods evolved. This makes analysis auditable and thus more trustworthy and reliable. (Ostblom and Timbers 2022)
git and GitHub
- git is a version control system – like “Track Changes” features from Microsoft Word.
- GitHub is the home for your git-based projects on the internet (like DropBox but much better).
- There are a lot of git commands and very few people know them all. 99% of the time you will use git to add, commit, push, and pull.